DPC REPORTS
SPECIAL REPORT | January 21, 2009
Senate Democrats Are Working for Change: Strengthening the Middle Class
Over the last eight years, life for millions of middle-class families has grown less affordable and less secure. Working Americans have suffered from lower wages, fewer jobs, and skyrocketing costs for basic necessities like gas, health care, and college tuition. Years of misguided fiscal policies and irresponsible regulatory failures have contributed to a financial meltdown that is crippling the national and global economy and threatening the American Dream for people throughout the country. Though our nation faces perhaps the most severe economic problems in generations, Senate Democrats know that the United States can both recover from the current economic crisis and make the investments we need to rebuild our economy for the long term.
As we move forward in the 111th Congress, Senate Democrats will honor the faith Americans have placed in us by advancing a forward-looking agenda that revives our economy, gets Americans working again, protects homeowners and consumers, makes America more energy independent, expands access to affordable, quality health care, and improves educational opportunities. Working together, we can turn the page on the last eight years and deliver the change Americans demand and the progress America so desperately needs.
Middle-Class Families Squeezed By Skyrocketing Costs
Health care premiums increased approximately 80 percent. The cost of family health insurance has skyrocketed nearly 80 percent since 2001.[1]This is compared to a 24 percent increase in overall inflation.[2] When premium growth outpaces increases in wages and inflation, workers typically have to spend a greater portion of their income each year in order to maintain coverage.[3] The average premium for a family of four rose to $12,680 in 2008, with the average family contribution of over $3,350.[4] From 2001 to 2008, the amount families pay out of pocket for their share of premiums has increased by approximately $1,550.[5]

Rising health care costs also jeopardize employer-sponsored coverage. When the cost of premiums increases, employers have more difficulty providing health coverage, and their workers have more difficulty affording their share of the cost. With the increased cost of premiums during the Bush Administration, there has been an erosion of employment-based health benefits. The percentage of non-elderly individuals with employment-based health benefits decreased from 68.4 percent in 2000 to 62.2 percent in 2007.[6]
The number of uninsured Americans has increased by 7 million people since President Bush took office, from 38.7 million in 2000 to 45.7 million in 2007.[7] A significant cause of the increase in the number of uninsured Americans is this decline in the number of people receiving health coverage through their employer.[8] In 2007, nearly two-thirds of U.S. adults, an estimated 116 million people, struggled to pay medical bills; went without needed care because of cost; were uninsured for a time; or were underinsured.[9] And given the weak economy, the number and percentage of uninsured likely rose in 2008 (the final numbers are not yet available), and will probably rise further in 2009[10]- the problems for Americans struggling with health care costs are only getting worse. Studies show that each one percent increase in unemployment will result in an additional 1.1 million uninsured.[11]
Gas prices reached historic highs.During the Bush-Chaney Administration,gas pricesjumped as much as 180 percentfrom$1.47 per gallon of regular gas the week President Bush took office in January 2001 to an all-time high of $4.11 in July 2008.[12]The price for a barrel of oil increased 370 percent during the Bush Administration from $31 in January 2001 to highs of $145in July 2008.[13]Before the financial crisis and the subsequent collapse in oil and gasoline prices, the average household with children was spending about $4,143on transportation fuel costs in 2008, an increase of 118 percent or $2,240over 2001 costs.[14]
College education costs have risen 70 percent.Since the 2000-2001 academic year, average tuition, fees, room and board costs at four-year private universities have increased by $11,892, from $22,240 to $34,132 in the 2008-2009 academic year.[15] Tuition, fees, room and board charges at four-year public colleges jumped from $8,439 for the 2000-2001 academic year to $14,333 for the 2008-2009 academic year - an increase of $5,894, or 69 percent.[16]
The cost of a college education is rising faster than family income, but key federal tuition assistance programs such as the Pell Grant program have failed to keep pace with the rising cost of college. While the maximum Pell Grant covered 51 percent of the cost of tuition, fees, room, and board at a public four-year college during the 1986-1987 school year, it covered only about one-third of those costs in the 2005-2006 school year.[17]
Housing affordability remains a pervasive problem.Years of abuse by the mortgage lending industry, lax regulation under the Bush Administration, lack of affordable housing, and poor choices by some homeowners have all resulted in a nationwide housing crisis that is crippling the entire U.S. economy. As a result, the American dream of owning a home is becoming less and less of a reality for millions of Americans and their families. During the third quarter of 2008, one in ten American homeowners found themselves either behind in mortgage payments or facing foreclosure.[18]According to the Mortgage Bankers Association, nearly 7 percent of mortgages were 30 days or more past due (an increase of 58 basis points from the previous quarter), a record high.[19]Disturbingly, this increase was due to the rise in mortgages past due by 90 days or more. According to RealtyTrac, more than 2.3 million U.S. properties faced foreclosure, an 81 percent increase from 2007, and it is likely that these numbers will rise in 2009 as subprime loans continue to adjust to higher rates and Americans grapple with job loss and rising unemployment.[20]
Once a problem for borrowers with poor credit, subprime mortgage usage has spread to more credit-worthy borrowers (some by choice, others by trickery) and with them, instances of foreclosure.[21]Moreover, while adjustable rate subprime mortgages continue to experience the highest rates of foreclosure, prime mortgages have also experienced increased delinquencies and foreclosures in the past year. Even homeowners with strong credit, who are in safe, fixed-rate loans are suffering from the reduction in property values and home equity wealth that result from foreclosures in their neighborhoods.[22]Entire communities, especially those that are already vulnerable to economic disruptions, are at significant risk.
The home loan crisis has only exacerbated the nation's ongoing affordable housing crunch. Despite dropping interest rates, the heightened underwriting standards for obtaining a home loan have made it more difficult for some Americans to purchase, increased job losses have made it more difficult for existing homeowners to make their mortgage payments, and the increased demand and cost for rental housing has made it more difficult for non-owners to rent.[23]In 2006, the Washington Post reported that "the scarcity of affordable housing is a deepening national crisis, and not just for inner-city families on welfare. The problem has climbed the income ladder and moved to the suburbs, where service workers cram their families into overcrowded apartments, college graduates have to crash with their parents, and firefighters, police officers and teachers can't afford to live in the communities they serve."[24]
According to the Joint Center for Housing Studies, between 2001 and 2006, the number of Americans in the two middle-income quartiles spending more than 50 percent of their income on rent rose by 1.4 million (as compared to a 1.2 million rise in the bottom income quartile). Moreover, "by 2006, middle-income homeowners were twice as likely as middle-income renters to pay more than half their incomes for housing." Housing is considered affordable if it makes up less than 30 percent of income.
Middle-Class Families Squeezed By Declining Income and Fewer Job Opportunities
While families worked harder, their wages continued to decline.Middle-class families are working harder and earning less today than they were eight years ago. Median household income, adjusted for inflation, has declined $333 from $50,566 in 2000 to $50,233 in 2007 (the latest year for which we have data).[25]
Between 2000 and 2007, the government's measure of take-home pay (median weekly earnings) increased by a mere 0.3 percent (adjusted for inflation), compared with 7.7 percent growth between 1989 and 2000 (the last comparable business cycle).[26]

Meanwhile, employment compensation has lagged behind productivity gains. While the productivity of the American worker (output per hour) rose by 19.08 percent between the fourth quarter of 2000 and the third quarter of 2008, average hourly compensation (wages plus benefits, adjusted for inflation) increased by only 6.3 percent during this period.[27]
In sum, Americans are working harder - and more productively - but are not receiving proportionally increased rewards for their hard work.
This is counter to historical trends: "Economic theory holds that when output per worker rises, so should wages , and hence living standards. In practice, that's what transpired so impressively in the United States during much of the last century. But recent data suggests that for many workers, the elixir has lost its potency...many observers contend that the link between productivity and pay is broken. Employees are working harder and smarter, they charge, but are reaping no reward for the extra effort."[28]
So who has benefited from these productivity gains? The New York Times reported that: "an outsized share of productivity growth, which expands the nation's total income, is going to Americans at the top of the income scale. In 2005...the top 1 percent of Americans - whose average annual income was $1.1 million - took in 21.8 percent of the nation's income, their largest share since 1929."[29]According to the Wall Street Journal, "[s]ince the end of the recession of 2001, a lot of the growth in GDP per person - that is, productivity - has gone to profits, not wages."[30]Economists at the National Bureau of Economic Research concluded that: "[t]o the extent that the productivity growth 'explosion' of 2001-2004 was achieved by cost-cutting, layoffs, and abnormally slow employment growth...the historical link between productivity growth and higher living standards falls apart. Not only have the bottom 90 percent of American workers failed to keep up with productivity growth, many have been harmed by it."[31]
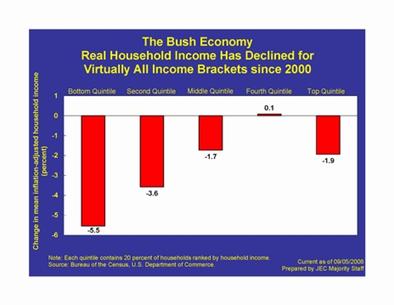
Indeed, the average income for 80 percent of American households has fallen since 2000 after adjusting for inflation. According to the Joint Economic Committee, changes in income over the past year have been regressive, with the average income of the bottom fifth declining two-an-a-half times more than the top fifth. "As a result of this pattern of losses at the bottom and gains at the top, income inequality is now greater" than it was before 2001.[32]
Earnings for workers with college degrees declining.TheWallStreet Journalobserved that"a four-year college degree, seen for generations as a ticket to a better life, is no longer enough to guarantee a steadily rising paycheck."[33]In addition, the Los Angeles Times reported that: "[w]age stagnation, long the bane of blue-collar workers, is now hitting people with bachelor's degrees for the first time in 30 years. Earnings for workers with four-year degrees fell 5.2 percent from 2000 to 2004 when adjusted for inflation, according to White House economists...Not since the 1970s have workers with bachelor's degrees seen a prolonged slump in earnings during a time of economic growth...trends for people with master's and other advanced degrees...have found that their inflation-adjusted wages were essentially flat between 2000 and 2004."[34]And, U.S. Census data indicates that "the number of college graduates earning below the poverty line has more than doubled in the past 15 years to almost 6 million people."[35]
Job creation among the worst since Hoover Administration.Over the course of his term in office, President Bush was in a statistical dead heat with his father for the worst overall job creation record since Herbert Hoover more than 70 years ago.
Overall non-farm payroll employment has increased by just 3 million since January 2001 compared with 22.7 million jobs created during the Clinton presidency.[36]Over the past eight years, overall employment growth has averaged just 31,800 jobs per month (or 0.3 percent per year)[37]- barely one-fifth of the 150,000 jobs needed each month to keep up with population growth. It was not uncommon to see monthly job gains of 300,000 and even 400,000 during economic expansions during the Clinton Administration.[38]
Private sector job creation has been especially poor during the Bush presidency, with only 3.4 million new non-governmental jobs created since 2001, an increase of only 0.4 percent per year.[39]

The Washington Timescompared the slow job creation growth rate of private sector jobs under the "Bush era" with the 23 percent increase in private sector jobs during the Clinton presidency (an increase of more than 21 million new jobs).[40]The manufacturing sector, often the source of jobs with good pay and benefits, has lost 4.1 million jobs since the start of the Bush Administration.[41]Given the turbulence and uncertainty in the economy today, the pace of job creation is an ominous sign for future job creation for America's middle-class families.
The unemployment rate rose to the highest level since 1993, leaving millions more unemployed.In part because of this failure to create a sufficient number of jobs, the national unemployment rate hit 7.2 percent in December 2008[42], 3 percentage points, or 71 percent, higher than the 4.2 percent rate when President Bush took office. This represents 11.1 million people who are officially counted as unemployed - 5.1 million more people than were unemployed in January 2001.
Unfortunately, once they lose their job, America's workers also are staying unemployed longer.[43]In December 2008, 23.2 percent had been unemployed for more than 26 weeks, almost four times its level since President Bush took office (from 676,000 in January 2001 to 2.6 million in December 2008).[44]And this doesn't even count the Americans who have been discouraged from looking for work (to be counted as unemployed by the government, a person must be actively looking for work), but does count those who want to work full-time but can only find a part-time job. And "[t]he problem is ensnaring a broader swath of workers than before. Once concentrated among manufacturing workers and those with little work history, education or skills, long-term unemployment is growing most rapidly among white-collar and college-educated workers with long work experience."[45]
Bush's deficit-financed tax cuts have widened the income gap between millionaires and middle-class workers.Data from the Internal Revenue Service indicates that the wealthiest one percent of Americans (with an average income of $1,316,000) earned 21.2 percent of all income while the bottom 50 percent earned only 12.8 percent of all income in 2005. A Wall Street Journal article entitled "Income-Inequality Gap Widens" observed that "[t]he richest Americans' share of national income has hit a postwar record, surpassing the highs reached in the 1990s bull market, and underlining the divergence of economic fortunes blamed for fueling anxiety among American workers."[46]
The Wall Street Journal has attributed the widening income gap to President Bush's tax policies: "[I]t appears that the highest-salaried workers - executives, managers and professionals - are widening their lead on the typical worker...The Bush tax cuts appear to have widened the income gap, according to many analyses."[47]The New York Times observed that IRS data "showed that over one-quarter of the investment tax cut savings went to just 11,433 taxpayers, (those who made $10 million or more) saving them almost $1.9 million each."[48]The Times also reported that a White House spokesman said that"the fact that nearly all of the growth in incomes was among those in the upper reaches of the income ladder and that the majority of investment tax breaks went to those making more than $1 million 'is not a very interesting story.'"[49]The St. Louis Post Dispatch summed it up: "The Bush tax cuts for the wealthy have thrown the federal budget deeper into deficit while doing little for ordinary Americans."[50]
In fact, President Bush's capital gains and dividends tax cuts will cost $2.349 trillion billion over ten years,[51]with most of the benefits going to the richest one percent of Americans.[52]In an analysis by the Tax Policy Center, economists found that the immediate effect of the Bush tax cuts has been "skewed in favor of those with high incomes," benefiting the most wealthy households the most.[53]In 2006, for example, "families making more than $1 million a year saw their after-tax income increase by 6 percent because of the tax cuts, while families making $40,000 to $75,000 saw after-tax income rise by about 2.5 percent."[54]
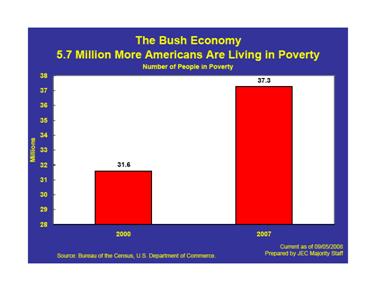
More American families and children face severe financial problems. In 2007, 37.3 million Americans were living in poverty,[55]an increase of 5.7 million over the 2000 level, the year before President Bush took office.[56]
The average annual increase in the poverty rate during President Bush's first term was second only to that during George H.W. Bush's administration and contrasts sharply with the declines in the Clinton and Kennedy-Johnson Administrations.[57]
Poverty has hit America's children particularly hard. According to the latest Census report, almost one out of every six American children lives in poverty.[58] The number of children living in poverty increased 15.38 percent during the Bush Administration.[59]
Middle-Class Families Squeezed By Record Levels of Debt
Bush Republicans turned record budget surpluses into record deficits. President Bush inherited a record budget surplus from President Clinton. Budget surpluses were expected to continue for another ten years when President Bush took office in January 2001. But under President Bush's watch, the federal budget plunged back into deficit, reaching record levels. And he is leaving behind the highest deficit ever recorded, with the 2009 deficit projected to reach $1.2 trillion, or 8.6 percent of GDP, under current policies.
Bush Republicans, addicted to borrowing, doubled the national debt. President Bush is the most fiscally irresponsible American president, having presided over the largest explosion of debt in our nation's history. During his time in office, President Bush requested that Congress increase the statutory debt limit seven times. At the end of 2009, the gross federal debt is projected to reach $11.6 trillion.
Enormous trade deficit is undermining U.S. competitiveness.In 2007, the annual U.S. trade deficit was $708.5 billion - twice the size of the trade deficit in 2000, the year before George Bush took office.[60]For November 2008, the Commerce Department reported a monthly trade deficit of $40.4 billion - when George Bush took office in January 2001, the monthly trade deficit stood at $33.3 billion.[61]As troubling, our trade in Advanced Technology Products, a strong indicator of U.S. competitiveness, which was in surplus as recently as 2001, experienced an annual deficit of more than $53 billion in 2007, and a monthly deficit of $4.581 billion in November 2008.[62]
Debt owed to foreigners climbs to record levels. In order to finance record budget deficits, the United States has had to borrow at unprecedented rates from foreigners. It took 42 Presidents 224 years to build up $1 trillion of foreign-held debt. President Bush more than tripled that under his watch, with total foreign-held debt standing at over $3 trillion as he left office.
Record government and personal debt levels threaten economic future. Record federal deficits and debt create record interest costs for Americans. In 2006, interest costs on the federal debt amounted to $405.9 billion and this figure will grow to $645 billion by 2017.[63]Personal debt levels have also reached a modern record. The Washington Post noted that "[f]lat wages and rising debt nationally have converged to leave millions of middle-class households feeling acutely vulnerable to bumps in their financial planning."[64]According to the Federal Reserve, in 2007, the ratio of financial obligations to disposable personal income reached an all-time high since the data was first collected in 1980.[65]The ratio, which accounts for mortgage, consumer, and other obligations, has remained high. In the third quarter of 2008, 19.05 percent of disposable income was spent on debt.[66]Meanwhile, "American consumers are holding debt in growing numbers and in larger amounts than ever,"[67]and "[m]ore Americans have fallen behind on consumer loans than any time in nearly 16 years, as credit problems once concentrated in mortgages spread into other forms of debt."[68]Indeed, the American Bankers Association recently reported that delinquencies on auto loans and home equity lines of credit reached their highest levels on record during the third quarter of 2008.[69]
Average student loan debt soared to more than $19,000. Interest rates for Stafford student loans have risen substantially over the past three years, from 3.4 percent to 7.14 percent for outstanding loans and 6.8 percent on new loans.[70]As a result, loan payments will be considerably higher for students taking out new loans and for those who did not consolidate loans in recent years. Without adequate federal grants funding, students and their parents must rely more on student loans to finance their college educations. According to the Institute for College Access and Success, more than 60 percent of college seniors graduate with debt, with an average $19,200 in debt per graduate.[71]And, according to the Institute for Public Policy and Higher Education, 31 percent of the median family income is needed to pay for one year at a four-year public college after financial aid.[72]
Meanwhile, the continuing credit crisis is affecting the ability of students and families to afford rising tuition costs. Lenders are increasing their lending standards and 39 lenders are no longer offering private student loans.[73]
Erosion of employer-provided pensions threatens Americans' retirement security.Workers' retirement planning once took place primarily within the context of the employment relationship: workers committed a certain number of years to the company and the company committed to providing retirement income. This is no longer the case. The movement from defined benefit to defined contribution plans has meant that workers are increasingly responsible for ensuring adequate income during their retirements. It has also meant that these workers solely bear the investment risks.[74]
Workers should be able to count on retirement promises made by their employers. An analysis by the Pension Benefit Guaranty Corporation (PBGC), the federal entity created by Congress to protect employee pensions, determined that nearly ten percent of pension plans halted benefit accruals in 2003 alone, the latest year for which complete data is available. According to PBGC Executive Director Bradley Belt, anecdotal evidence suggests that this number has been even higher since then. A study by the Employee Benefit Research Institute (EBRI) found that, in the past two years, over one-third of surveyed companies froze their pensions and another one-third will be looking to close or freeze their pensions in the next two years.[75]EBRI showed that the percentage of workers who said they were "very confident about having enough money for retirement" decreased from 27 percent to 19 percent - the sharpest one-year drop in 18 years.[76]Moreover, the "collapse of the stock market last year left corporate pension plans at the largest companies underfunded by $409 billion." [77]The "need to cover pension shortfalls" could lead to "such tradeoffs as reductions in wages, benefits and jobs."[78]
Moreover, recent investor surveys and research indicates that there is a troubling racial disparity in the participation rates in 401(k) plans and retiree savings, suggesting that "the decline of pensions may disproportionately affect blacks" and other people of color.[79]One company found that "race was a more powerful predictor of an employee's retirement plan activity than age, gender, work experience or income."[80]This can also be true for blue-collar workers, who are at greater financial risk as a result of the shift in their retirement from defined benefit to defined contribution.
Even individuals who invest their retirement savings may not experience sufficient growth to retire comfortably. Someone who invested in a recommended 401(k) account indexed to the S&P 500 the day before President Bush was sworn into office in 2001 would have lostmoney (after accounting for inflation) if they withdrew those funds this month. According to the Wall Street Journal, "the stock-market rout has ignited a crisis of confidence for millions of Americans who manage their own retirement savings through 401(k) plans.[81]Their success depends "largely on the luck of the stock-market draw."[82]And, "while 401(k) participants have been through stock slides before, now they are also grappling with declines in home values and tighter consumer credit. What's more, health-care costs are rising fast, and people are living longer."[83]
The New York Times observed that "the simple price return [on the S&P 500] so far in this decade is the worst since the 1930s, when the Great Depression occurred. But the inflation-adjusted figure for total return is actually worse than the 1930s."[84]When adjusted for inflation,[85]the S&P 500 has actually declined by 446.9 percent between January 19, 2001 and January 16, 2009.[86]Even before the financial crisis took hold of the markets in the fall 2008, a columnist expressed his concern that "the most widely-watched domestic market benchmark [the S&P 500] is back below where it was in February 2000...Baby Boomers [who are] planning to dip soon into their life savings are quickly running out of time to recoup their losses."[87]The Los Angeles Times summed it up: "As Americans increasingly link their well-being to financial markets, the possibility of recession and a slump on Wall Street has taken on new meaning for the middle class, including baby boomers who are approaching retirement age."[88]The result? "[M]any aging Americans are delaying retirement, electing labor over leisure in uncertain times."[89]
[1]The average annual premium cost for family health coverage in 2008 was $12,680, compared with $7,063 in 2000. Kaiser Family Foundation, 2001 Employer Health Benefits Survey Report, available here; The Henry J. Kaiser Family Foundation and Health Research and Educational Trust, September 2008, available here .
[3]The Henry J. Kaiser Family Foundation, August 2007.
[4]The Henry J. Kaiser Family Foundation and Health Research and Educational Trust, September 2008, available here.
[5]The Henry J. Kaiser Family Foundation and Health Research and Educational Trust, September 2008; and The Henry J. Kaiser Family Foundation, Health Research & Educational Trust, News Release (September 6, 2001).
[6]Employee Benefit Research Institute, September 2008.
[7]U.S. Census Bureau, Income, Poverty, and Health Insurance Coverage in the United States: 2007 (August 2008), available here; U.S. Census Bureau, Health Insurance Coverage: 2000 (September 2001), available here.
[8]Employee Benefit Research Institute, October 2007.
[9]Commonwealth Fund, August 2008.
[10]Center on Budget and Policy Priorities, August 2008.
[11]Stan Dorn, et al, "Medicaid, SCHIP and Economic Downturn: Policy Challenges and Policy Responses" The Henry J. Kaiser Family Foundation, Kaiser Commission on Medicaid and the Uninsured (April 2008).
[12]Energy Information Administration, Weekly Retail Gasoline and Diesel Prices (updated September 28, 2008), available here (see historical data for 2001 numbers).
[13]Energy Information Administration, Spot Prices for Crude Oil (updated June 8, 2008), available here.
[14]Calculations based on data available from Energy Information Administration, Household Vehicle Energy Use: Latest Data and Trends; Short Term Energy Outlook (November 2007), available here, Household Vehicles Energy Use: Data Tables, Table A2 (released November 2005), available here.
[17]Analysis of Department of Education data contained in U.S. Senate Committee on Health, Education, Labor, and Pensions, "A New Commitment to Students and Families: Opening the Door to College for All" at 2.
[18]Bloomberg, "Mortgage Delinquencies, Foreclosures Rise to Record" (December 5, 2008), available here.
[19]Mortgage Bankers Association, "Delinquencies Increase, Foreclosures Start Flat in Latest MBA National Delinquency Survey," (December 5, 2008), available here.
[21]Rick Brooks and Ruth Simon, Subprime Debacle Traps Even Very Credit-Worthy, Wall Street Journal at A1 (December 3, 2007).
[22]"The fall in home prices has cut into Americans' home equity and forced many to grapple with mortgages now worth more than the house itself." Michael M. Grynbaum, Consumer Confidence Slips as Home Prices Drop, New York Times (April 29, 2008).
[23]Joint Center for Housing Studies of Harvard University, The State of the Nation's Housing 2008 availablehere; Les Christie, "Most Middle Class Still Can't Buy a House," CNNMoney.com(January 31, 2008), available here.
[24]Michael Grunwald, "The Housing Crisis Goes Suburban," WashingtonPost at B01 (August 27, 2006).
[25]U.S. Census Bureau, Income 2000, available here; Income, Poverty, and Health Insurance Coverage in the United States: 2007 (August 2008), Figure 1 (in 2007 dollars), available here.
[26]Joint Economic Committee analysis of U.S. Department of Labor, Bureau of Labor Statistics (January 9, 2009), available here. Median usual weekly earnings of full-time wage and salary workers by selected characteristics, quarterly averages, not seasonally adjusted, available here.
[27]Joint Economic Committee analysis of U.S. Department of Labor, Bureau of Labor Statistics (January 9, 2009), available here.
[29]Editorial, "Economic Life After College," New York Times at A18 (June 11, 2007).
[30]Greg Ip, "Wages Fail to Keep Pace With Productivity Increases, Aggravating Income Inequality," Wall Street Journalat A2 (March 27, 2006).
[31]Ian Dew-Becker and Robert J. Gordon, Where Did the Productivity Growth Go? Inflation Dynamics and the Distribution of Income (December 2005) at 62, available here.
[32]Joint Economic Committee analysis of U.S. Department of Labor, Bureau of Labor Statistics (January 9, 2009), available here.
[33]Greg Ip, "The Declining Value of Your College Degree," Wall Street Journal (July 17, 2008).
[34]Molly Hennessy-Fiske, "That Raise Might Take 4 Years to Earn as Well: Those with bachelor's degrees are finding their incomes stagnate despite a growing economy," Los Angeles Times at A1 (July 24, 2006).
[35]AP, "College degree may not be enough to protect against poverty" (April 29, 2007).
[36]Joint Economic Committee analysis of U.S. Department of Labor, Bureau of Labor Statistics (January 9, 2009), available here. U.S. Department of Labor, Bureau of Labor Statistics, Employment, Hours, and Earnings from the Current Employment Statistics survey (National), Table B-1. Employees on nonfarm payrolls by industry sector and selected industry detail (preliminary) (January 9, 2008), available here.
[37]Id.See also Editorial, "Job Figures in Context," Washington Times (July 23, 2007), available here.
[38]See e.g., Speech of Gary H. Stern,President, Federal Reserve Bank of Minneapolis, Perspectives on the Economy (March 29, 2007), available here.
[39]Joint Economic Committee analysis of U.S. Department of Labor, Bureau of Labor Statistics (January 9, 2009), available here.
[40]Id.See also Editorial, "Job Figures in Context," Washington Times (July 23, 2007), available here.
[41]U.S. Department of Labor, Bureau of Labor Statistics, Employment Situation Summary (January 9, 2009) available here.
[42]Id.
[43]Conor Dougherty, "How Job Report May Be Masking Labor Pains," Wall Street Journal at C1 (September 7, 2007).
[44]Joint Economic Committee analysis of U.S. Department of Labor, Bureau of Labor Statistics (January 9, 2009), available here. U.S. Department of Labor, Bureau of Labor Statistics, Labor Force Statistics from the Current Population Survey, Table A-9, available here.
[45]Michael A. Fletcher, "Highly Skilled and Out of Work: Long-Term Joblessness Spreads in Middle Class," WashingtonPost at A01 (January 21, 2008).
[46]Greg Ip, "Income-Inequality Gap Widens,"Wall Street Journal (October 12, 2007).
[47]Greg Ip, "Wages Fail to Keep Pace With Productivity Increases, Aggravating Income Inequality," Wall Street Journal at A.2 (March 27, 2006).
[48]David Cay Johnson, "2005 Incomes, on Average, Still Below 2000 Peak," New York Times (August 21, 2007).
[49]Id.
[50]St. Louis Post Dispatch, "Falling Behind Dad" (May 30, 2007).
[51]Citizens for Tax Justice, The Bush Tax Cuts: The Latest CTJ Data (March 2007) at 2, available here.
[52]Id.[based on income group].
[53]Greg Leiserson and Jeffrey Rohaly, "The Distribution of the 2001-2006 Tax Cuts: Updated Projections, November 2006," The Tax Policy Center (November 15, 2006), available here.
[54]Michael Abramowitz and Lori Montgomery, "Bush Addresses Income Inequality," The Washington Post at A04 (February 1, 2007), citing "The Distribution of the 2001-2006 Tax Cuts: Updated Projections," supra.
[55]Joint Economic Committee analysis of U.S. Department of Labor, Bureau of Labor Statistics (January 9, 2009), available here.
[56]Id. U.S. Census Bureau, CPS 2000 Annual Social and Economic Supplement, POV01 (December 11, 2001), available here.
[57]Joint Economic Committee analysis of data maintained by the Bureau of the Census and U.S. Department of Commerce from 1959-1995.
[58]U.S. Census Bureau, Income, Poverty , and Health Insurance Coverage in the United States: 2007 (August 2008), available here.
[59]U.S. Census Bureau, CPS 2000 Annual Social and Economic Supplement, POV02 (December 11, 2001), available here.
[60]U.S. Department of Commerce, Bureau of Economic Analysis, U.S. International Trade in Goods and Services Foreign Trade Statistics, U.S. Trade in Goods and Services - Balance of Payments (BOP) Basis, available here.
[61]U.S. Department of Commerce, Bureau of the Census and the Bureau of Economic Analysis, U.S. International Trade in Goods and Services: November 2008 (January 13, 2009), available here and U.S. International Trade in Goods and Services: January 2001 (March 20, 2001), available here.
[63]Congressional Budget Office (August 2007).
[64]Jeffrey H. Birnbaum and Chris Cillizza, "'Mortgage Moms' May Star in Midterm Vote; With Wages Stagnant and Debt Growing, Democrats See an Opportunity," WashingtonPost at A01 (September 5, 2006).
[65]The Federal Reserve, Household Debt Service and Financial Obligations Ratios (updated December 18, 2008), availablehere.
[66]Id.
[67]Increasing consumer Debt Level Raises Bankruptcy Filings, St. Louis Fed Reports, BNA Daily Report for Executives(April 9, 2008).
[68]Jonathan Stempel, Late Payments on Consumer Loans at 16-year high, USA Today (April 3, 2008).
[69]Nancy Trejos, "Loan Delinquencies Hit Record High Last Year," WashingtonPost (January 8, 2009).
[70]David P. Smole, "Stafford Loan Interest Rate Reduction: Background and Issues," Congressional Research Service Pub. No. RS22568 (July 20, 2007).
[71]The Institute for College Access and Success (2006), based on an analysis of data from the Department of Education, National Postsecondary Student Aid Study (2004) cited in "A New Commitment to Students and Families: Opening the Door to College for All" prepared by the U.S. Senate Committee on Health, Education, Labor, & Pensions (July 2007) at 12.
[72]The Institute for Public Policy and Higher Education, Measuring Up 2006: The National Report Card on Higher Education cited in "A New Commitment to Students and Families: Opening the Door to College for All" prepared by the U.S. Senate Committee on Health, Education, Labor, & Pensions (July 2007) at 11.
[73]Robert Tomsho, "Tuition Ammunition: a Happy Lesson on Lending" Wall Street Journal (January 6, 2009).
[74]Eleanor Laise, "Big Slide in 401(k)s Spurs Calls for Change," Wall Street Journal (January 8, 2009).
[75]Jack VanDerhei, Retirement Income Adequacy after PPA and FAS 158: Part One - Plan Sponsors' Reactions, Employee Benefit Research Institute (July 2007), available here.
[76]Nancy Trejos, Bleaker Hopes for a Good Retirement, WashingtonPost at D01 (April 8, 2008).
[77]David S. Hilzenrath, "2008 Leaves Pensions Underfunded," WashingtonPost, (January 8, 2009).
[78]Id.
[79]Daniel Sorid, "Blacks Retirement Security at Risk," AP (October 11):
·"Exelon Corp., the country's largest operator of nuclear power plants, discovered this year that about 15 out of every 100 black employees did not participate in its 401(k) plan, compared with around 10 of every 100 whites. It also found that one in three black employees contributed less than 5 percent of their pay to the plan, compared to just 14 percent of whites."
·"A survey by Charles Schwab Corp. and Ariel Mutual Funds concludes that four in 10 African Americans with household incomes of $50,000 or more have no money in stocks, compared to just one quarter of whites."
·"Ariel's survey also found blacks who enrolled in retirement plans save a median $173 a month while whites save $252."
·"A separate survey of retirees found whites are nearly twice as likely to have $100,000 or more saved than blacks, even when education, peak income level and other factors are held constant."
[80]Id.
[81]Eleanor Laise, "Big Slide in 401(k)s Spurs Calls for Change," Wall Street Journal (January 8, 2009).
[82]Id.
[83]Id.
[84]Floyd Norris, Not the Decade to Shopping with a Wallet Full of Stocks, New York Times (September 8, 2007).
[86] The closing price of the S&P 500 on January 19, 2001 was $1,342.54, or $1,600.13 in 2008 dollars January 16, 2009, the price close was $850.12. See Yahoo! Finance, S&P 500 Index, Historical Prices, available here.
[87]Mike Ivey, "Not watching is best market advice," The Capital Times (January 22, 2008) available here.
DPC
CONTACTS
DPC
- Erika Moritsugu (224-3232)